
⚠️ Warning: This post is over a year old. The information may be out of date.
Table of Contents
This is the last article is a series of three articles regarding memory management in Swift. If you’re new to memory management in Swift, the first article talks all about it! If instead you’re looking for common issues, you can read the second article here.
Xcode provides two tools out of the box to debug complex retain cycles:
- Memory Graph Debugger
- Memory Leaks Instrument
The first one is much more user-friendly, but can sometimes overlook certain issues in the app. This article will show how both of them are used, and when to use one versus the other. I’ll also share another “technique”, which I’m calling here “Divide and Conquer” — but is really a last resort way of finding particularly elusive retain cycles.
Memory Graph Debugger
Let’s take this simple example, of a view controller that accidentally retains itself through a delegate:
final class MyView: UIView {
    var delegate: MyViewDelegate?

    override func touchesEnded(_ touches: Set<UITouch>, with event: UIEvent?) {
        self.delegate?.userDidTapOnView(self)
    }
}

final class ViewController: UIViewController {
    private var myView: MyView!

    override func viewDidLoad() {
        super.viewDidLoad()

        self.myView = MyView()
        self.myView.backgroundColor = .red
        self.myView.translatesAutoresizingMaskIntoConstraints = false
        self.view.addSubview(self.myView)
        NSLayoutConstraint.activate([
            self.view.safeAreaLayoutGuide.topAnchor.constraint(equalTo: self.myView.topAnchor),
            self.myView.widthAnchor.constraint(equalToConstant: 100.0),
            self.myView.heightAnchor.constraint(equalToConstant: 100.0),
            self.view.centerXAnchor.constraint(equalTo: self.myView.centerXAnchor),
        ])
        self.myView.delegate = self
    }
}
Code language: HTML, XML (xml)
In the example project provided here, we’re displaying this view controller and then dismissing it, and we observe that it doesn’t get deallocated. First things first, to debug object allocations properly, the malloc stack logging must be enabled in the project’s scheme:
Let’s launch the Memory Graph Debugger and see what it has to say about it. The Memory Graph Debugger is available in the bottom toolbar of Xcode, when an application is running. It has 3 dots connected by 2 lines:

Once launched, make sure you’re on the right tab (the second tab from the right):

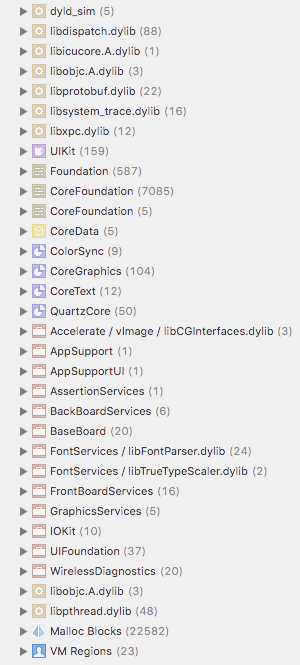
It will display in the left panel all the objects that currently exists in the app (there’s a lot!).
The Memory Graph Debugger is sometimes handy, however even for simple leaks such as this one it fails to detect it properly. If you know that an object is not being deallocated when it should be (for example by putting a breakpoint in deinit and observing that nothing stops there).
In the bottom corner, you can enter a search term and filter with the object you’re interested in — here it’s our ViewController:
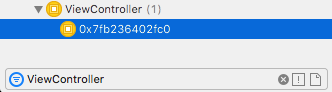
Clicking on it displays what is referencing the ViewController:
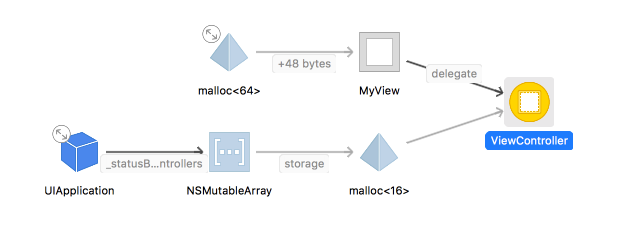
Here we can observe that the delegate property of MyView is strongly referencing ViewController:
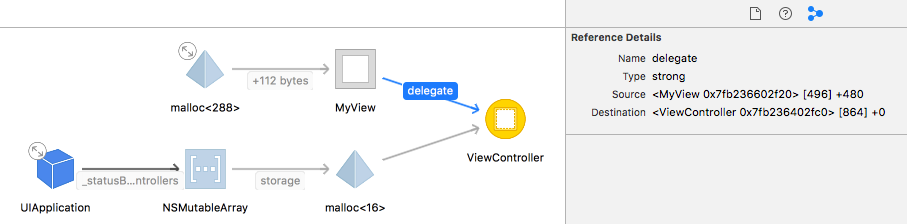
As expected, using a weak reference (weak var delegate: MyViewDelegate?) fixes the issue and the ViewController gets deallocated properly.
Memory Leaks Instrument
The Leaks Instrument is a more advanced tool than the Memory Graph Debugger. But while it’s more powerful it’s also harder to use. Using the same example as the above, running the app with the Leaks Instrument gives the following result:
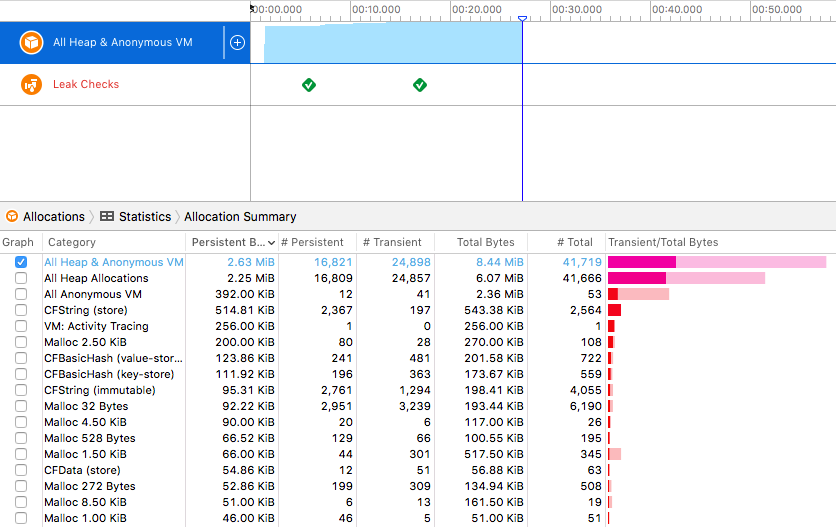
The Leaks Instrument records the memory usage and reference counts of every objects that gets created and deleted in the app. Given an instance of an object, the instrument can let you know when an object is created, when it is deallocated (if ever), and when its reference count increased or decreased. For example, given our ViewController instance from before, if we look for it:
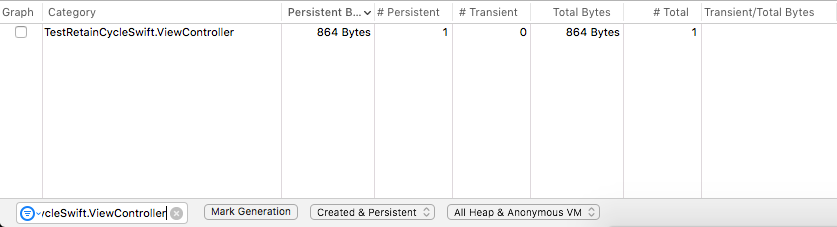
We can then select it, and hit the little arrow that appears next to it:

The view will transition to another view containing all the deallocated and living instances of this type:

Here, we can see that we only ever had one instance of it, and that it’s still living — something is definitely happening there!
If we drill down one more time, we’ll access the reference count history of this instance, and then it’s up to you to figure out why its reference count never reached 0.
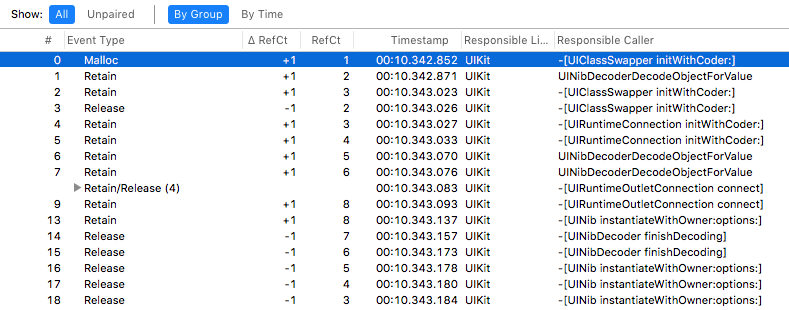
One of the reasons this tool can be harder to use is that there can be thousands of reference count changes. By default, instruments will try to group the retain/release together, which might lead to in a non-chronological reference count change. If you want the chronological changes, make sure to select “By time” at the beginning. You can also choose to unpair the changes by clicking on “Unpaired”.
Clicking on a line will display its full stack trace when it happened, allowing you to figure out where and when it happened. You’ll usually be looking for issues in your own code, so you should assume that the Responsible Library will be your app’s name. Here’s the line where the reference count increases for us, without a corresponding dealloc:

Double-clicking on the ViewController.viewDidLoad() line in the stack trace on the right directly lead us to the incriminating line.
Divide and Conquer
This is something I found myself (and my coworkers) do a few times, when a retain cycle is happening and neither the Memory Graph Debugger or the Leak Instrument helped. This usually happens for views that are used a lot in the app, and the retain cycle happens only for certain user input.
This approach consists of simply deleting pieces of code until the retain cycle disappears — and once it disappears, re-adding them back until the line causing it is identified. For this reason, this is a “brute force” method that should only be used as a last resort when other debugging attempts have failed.
Another variant of this approach is to use git bisect to help identify the specific commit where the cycle wasn’t happening along with the commit that introduced the offending change.
Conclusion
You’re reached the end of the series!
I hope all or some of the articles were helpful to you, and that you’ve learned a thing or two about how memory is managed in Swift, and how to manage it properly.
Should you have any comments, don’t hesitate to leave them!